
Debugging with Deftness in Visual Studio Code
Here’s a short list of keyboard shortcuts for debugging in Visual Studio Code. Right now, I don’t do a good job using many of these myself, but by writing them down for you I’m reminding myself to integrate them into my workflow. These hotkeys won’t shave hours off of your debugging sessions, but they may make the experience more enjoyable.
Inserting Print Statements
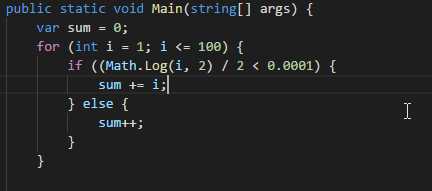
Sometimes all you really need in order to discover what your code is doing wrong is a simple print statement in the middle of a complex set of operations.
You can whip up a print statement lickety-quick in VS Code by typing ‘cw’ and hitting tab. ‘cw’ is the identifier of a snippet that expands to ‘System.Console.WriteLine()’.
Commenting out lines of code.
When attempting to diagnose a problem, you will often need to observe the effect of a small change to your code. If the change is super small, you might simply replace the old code with a new experiment. If that modification solves the problem, then you’re done. Hooray! But if not, you’ll need to revert that code back to the way it was. If you alter a substantial amount of code, it might be hard to remember what it looked like when you go to change it back.
Here’s where a tiny workflow pattern can save you time.
Because you don’t know beforehand whether your edit will fix the bug, you will want to preserve the original code. The simplest means to achieve this is to duplicate the original code, comment it out, and edit the copy.
In VS Code, the procedure looks like this:
The keys I pressed were Alt-Shift-Up to duplicate the line, then Ctrl-/ to comment it out.
This way, if your new code works, you can remove the old line by navigating to it and pressing Ctrl-Shift-K.
Or, if you determine that the bug lies elsewhere, you can just delete the new code and uncomment the old one.
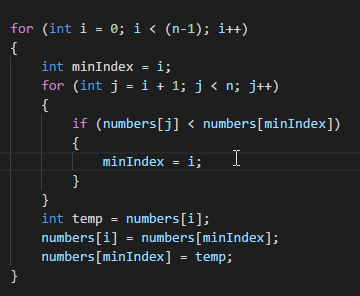
Plus, this trick works for multiple lines as well. Just select the lines you want to copy before keying in the Alt-Shift-Up shortcut.
Getting serious – Opening the Debugging Pane
If simple printout statements and minor code tweaks aren’t enough to ferret out the errors in your code, it’s time to break out the big guns. Although VS Code is a lightweight editor, it comes with a capable debugger.
Open the Debugging pane with Ctrl-Shift-D
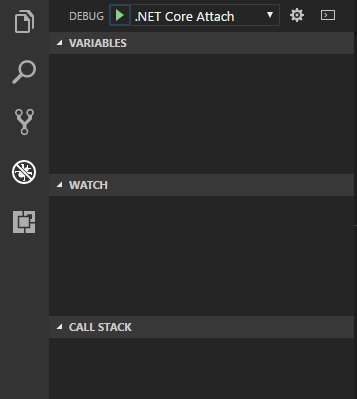
From here, you get a pane showing the values of variables, a list that lets you toggle and navigate to any of the breakpoints that you have set, and a button that lets you attach the debugger to a running process. Nifty stuff!
The Bread and Butter of Debugging
Pressing F9 will instantly set a breakpoint on the current line (or remove a breakpoint if one was already set there).
While I appreciate this shortcut, this is one situation in which the mouse often beats the keyboard. See, when you are debugging, you spend a lot of time scrolling around various code files with the mouse until you identify a first-rate spot for a breakpoint. At that point, your hand is already on the mouse, so you might as well just click the little empty space to the left of the line number to set the breakpoint.
Once you have one or more breakpoints in place, it’s time to run your code with the debugger. If you have a build file set up correctly, you can press F5 to start your program under the debugger. Otherwise, you can launch your program as normal and then use the dropdown at the top of the debugging pane to attach to it.
Now that you are into the code, the two most important keys to keep in mind are F10 and F11.
F10 executes the current line, and stops on the next line, skipping any code inside of the method that was called.
F11 executes the current line, but dives into the method, pausing execution on the first line so that you can inspect its operation.
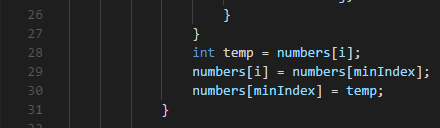
Occasionally, you may find yourself so deep into the code that you are seeing low-level library calls. In this case, you can get back “out” to your own code by pressing Shift-11. Stepping out takes you to the line that invoked the method you are in right now.
Go Forth and Debug!
That’s all of the debugging shortcuts I have for now. Probably the most helpful tips to remember are the ‘cw’ print snippet and remembering to copy and comment before making edits.